Sometimes it can be difficult to understand exactly what's going on in a ConditionalNG. LogixNG therefore has a debugger that allows a step by step walk thru a ConditionalNG to see what it's actually doing.
To use the debugger, it must be enabled. In Preferences ⇒ LogixNG, the option Install debugger must be enabled.
The debugger supports two different tools. The first one is an IDE style debugger which supports single step operation, breakpoints, etc. This provides a detail look at what happens for a single ConditionalNG. The second one displays each statement before and/or after it is executed for every active ConditionalNG. This can provide a history of the actions and expressions. Since this applies to all ConditionalNGs, it also provides insight into how different ConditionalNGs might interact. See Statement Logging. Note: Both tools can be used at the same time.
To run a ConditionalNG using the debugger, click on the Debug button in the LogixNG ConditionalNG list. The status pane will open with the editor listing in the left section.
The Debugger menu will be in the menu bar.
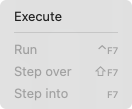
The debugger starts when the ConditionalNG is executed, for example when one of its actions or expressions triggers it. The ConditionalNG can also be executed by selecting the menu choice Debug ⇒ Execute.
The current action/expression has a thick top border before it is processed and and a thick lower border afterwards.

When the ConditionalNG has started executing, the debugger will stop it before the first action.
You can then step by step thru the ConditionalNG by selecting the menu item Debug ⇒ Step into. The debugger will then stop both before and after executing/evaluating the action/expression.
If the item has children, you can jump over the children by instead selecting the menu item Debug ⇒ Step over. Step over means that the debugger will process the children items without stopping before and after each one. When the children items have been processed, the debugger will stop after the parent item. Note: If a child has a breakpoint, processing will stop at that child even though step over is active.
If you want to run the ConditionalNG instead of stopping on each item, you select the menu item Debug ⇒ Run. Run is frequently used with breakpoints to stop at a particular row.
Breakpoints can be set on a row using the context menu.
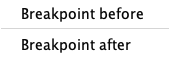
The breakpoint border uses the same border concept for before and after.

When the breakpoint occurs, the borders are combined.
On the right side of the debugger window, there are three panes. The top pane shows status if it's available. Example of status is the return value of expressions. If the debugger stops after an expression, the status pane will show the result of the expression, for example Return value True.
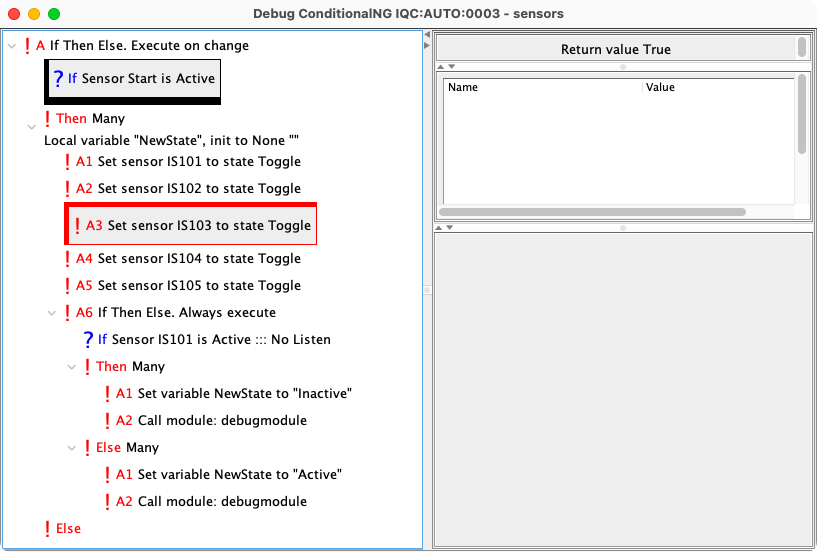
On the right side of the debugger window, the middle pane shows the current local variables.
When the debugger stops before or after an action/expression in the ConditionalNG, it blocks further execution of both this ConditionalNG and all other ConditionalNGs that is executed in the same thread. It's therefore recommended to move the ConditionalNG to a separate thread when the debugger is used, so that the debugger doesn't block the other ConditionalNGs. See Edit ConditionalNG Threads.
The Log all before and Log all after LogixNG preferences are used to control the statement logging process. When enabled, the expressions and actions will be displayed on the JMRI System Console as they are executed. The system console is opened using Help ⇒ System Console. Using a startup action for the JMRI System Console is recommended.
The preferences can be enabled or disabled and saved at any time. For example, do some preliminary setup. Enable the preferences, do the process, and then disable the preferences. Then the System Console Copy to clipboard button can be used to copy and paste into a text document for further analysis.
Here is a simple LogixNG.
LogixNG: IQ:AUTO:0001
ConditionalNG: IQC:AUTO:0001
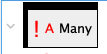
! A
Many
! A1
If Then Else. Execute on change
? If
And. Evaluate All
? E1
Sensor ISCLOCKRUNNING is Inactive
! Then
Log data: Only text: Clock is stopped
! Else
Log data: Only text: Clock is running
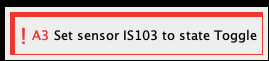
! A2
Call module: Module
Here are the Before and After lines with both preferences enabled and the sensor is changed to active.
WARN  - LogixNG Before: IQ:AUTO:0001, IQC:AUTO:0001: Many
WARN  - LogixNG Before: IQ:AUTO:0001, IQC:AUTO:0001: If Then Else. Execute on change
WARN  - LogixNG Before: IQ:AUTO:0001, IQC:AUTO:0001: And. Evaluate All
WARN  - LogixNG Before: IQ:AUTO:0001, IQC:AUTO:0001: Sensor ISCLOCKRUNNING is Inactive
WARN  - LogixNG  After: IQ:AUTO:0001, IQC:AUTO:0001: Sensor ISCLOCKRUNNING is Inactive --- Return value False
WARN  - LogixNG  After: IQ:AUTO:0001, IQC:AUTO:0001: And. Evaluate All --- Return value False
WARN  - LogixNG Before: IQ:AUTO:0001, IQC:AUTO:0001: Log data: Only text: Clock is running
WARN  - Clock is running
WARN  - LogixNG  After: IQ:AUTO:0001, IQC:AUTO:0001: Log data: Only text: Clock is running
WARN  - LogixNG  After: IQ:AUTO:0001, IQC:AUTO:0001: If Then Else. Execute on change
WARN  - LogixNG Before: IQ:AUTO:0001, IQC:AUTO:0001: Call module: Module
WARN  - LogixNG Before: IQ:AUTO:0001, IQC:AUTO:0001: Log data: Only text: Module called
WARN  - Module called
WARN  - LogixNG  After: IQ:AUTO:0001, IQC:AUTO:0001: Log data: Only text: Module called
WARN  - LogixNG  After: IQ:AUTO:0001, IQC:AUTO:0001: Call module: Module
WARN  - LogixNG  After: IQ:AUTO:0001, IQC:AUTO:0001: Many
The Before lines are by start sequence. The After lines are by completion sequence. When an item has subordinate items, such as Many, If and And in the example, the Before and After lines will be separated.
The After line for Expressions includes the resulting true/false state.
The LogixNG and ConditionalNG names identify the source of the log entry. When a conditional calls a module, the names do not changed since the module is running within the conditional context. If Before is enabled, the Call module action identifies the call to the module. If After is enabled, the After Call Module will show the return point. If After is not enabled, the return is not visible and has to be deduced by looking at the Before lines based on the statement sequence.