JMRI provides a communications monitor window so you can see what's happening on the layout network.
Once you open a Console window, it will automatically display all traffic.
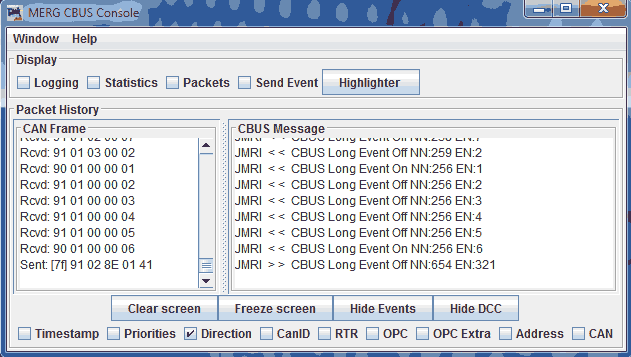
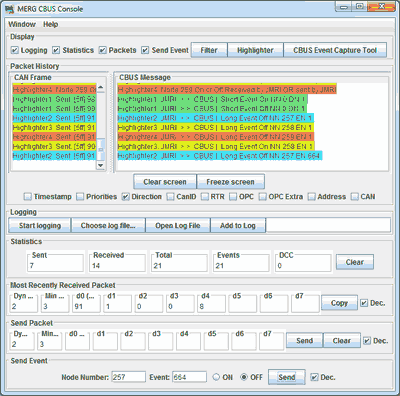
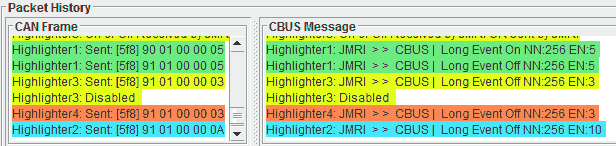
The left part contains the raw CAN frames. The right part interprets their CBUS meaning.
If the CBUS event table is running, the event table will be queried for event and node names.
You can open multiple console windows, whereby an instance number is added to the title
bar.
This number is also added to any Filter, Highlight or event Capture windows which are opened
via the console.
You can drag the window boundaries between these to suit your display.
The vertical scrollbar synchronises both windows.
Short CBUS events appear in the Console with a node number of 00.
Sometimes, it's helpful to capture what's happening. For example, you might encounter a bug (!!), and want to send a copy of what's happening to the people who are trying to fix it.
Small amounts of data can be copied from the log window with your computers "copy" command (e.g. ctrl-C or cmd-C), and then pasted into an email.
If you want to capture more, you can have the window write a log file on your computer's disk. To do this:
You can view contents of the log file by clicking on the Open Log File Button.
If you'd like to annotate the message log with your own comments, enter a comment and press ENTER or click the Add to Log button.
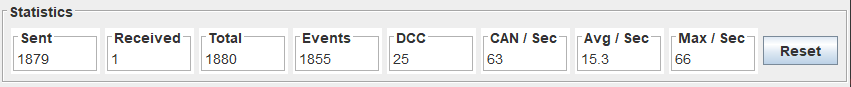
This part of the window shows some CAN Frame statistics.
The statistics show Frames from the Console opening.
The button resets the values to zero and resets the timer for average calculations.
Note that there is upstream buffering of CAN Frames within JMRI before the Console receives them, so values may not necessarily reflect those on the actual CAN.
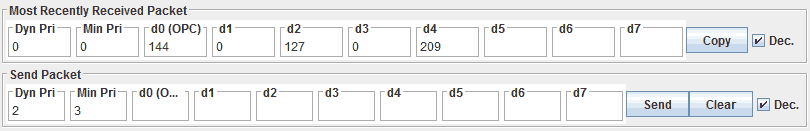
This displays the most recent packet received from the layout, along with a send packet
tool.
The individual elements displayed are dynamic and minor priority, the first data byte which
is the CBUS opcode and the remaining, up to seven, data bytes.
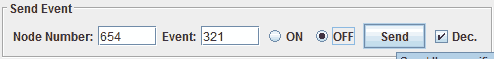
At the bottom part of the Console, you can construct an Event packet to be sent to the
layout. For normal operation, do not edit the preloaded values in the dynamic and normal
priority fields.
Enter the opcode and the correct number of data bytes (depending upon the opcode).
If the decimal data entry/display checkbox is not selected then data entry will, by default, be treated as hexadecimal. If the decimal data entry/display checkbox is selected then data entry will, by default, be treated as hexadecimal.
At any time, you may force data entered to be treated as hexadecimal, decimal or binary by adding a "0x", "0d" or "0b" prefix. For example "0x20", "0d32" and "0b00100000" all donate a decimal value of 32.
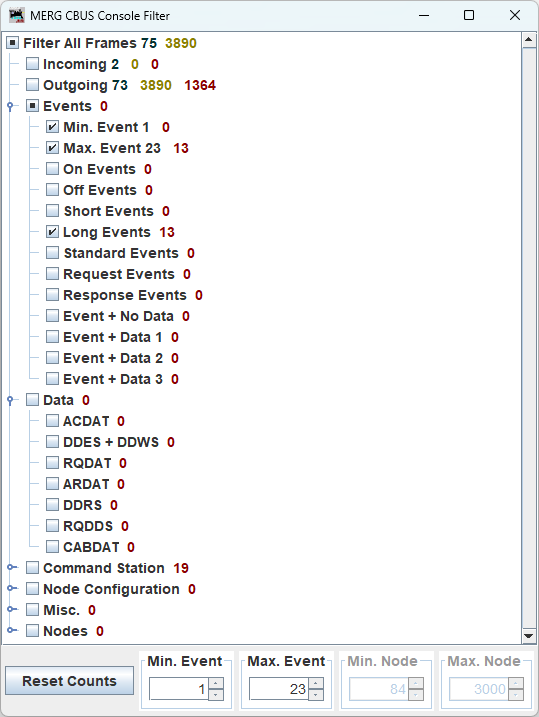
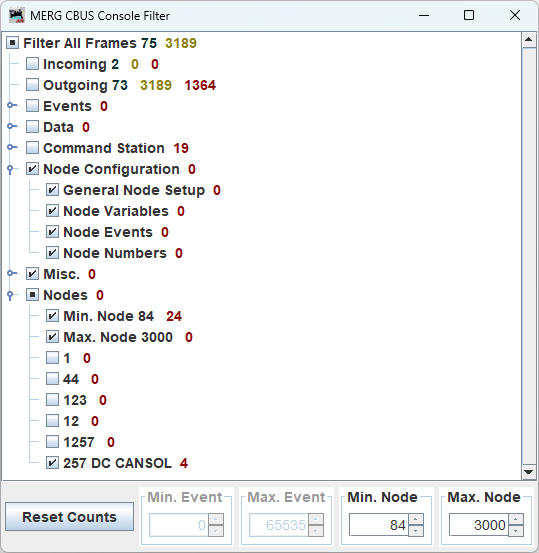
The filter logic works from top-to-bottom, following the order of the list for any applicable categories.
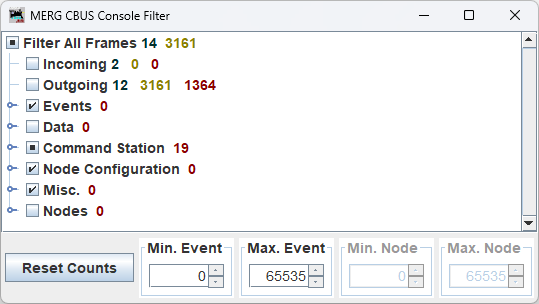
The filter listens for new nodes heard on the network, when a new node is heard it is listed under Nodes and is filterable.
The minimum and max event ( device ) number filter also applies to data device numbers.
The node filter works for all OPCs with a 2 byte node value, including node programming.
To see which OPC's are included mouse-over the sub-category.
( You can set the time the tooltip is displayed for in Main Prefernces > Display ).
OPC's are not modified to a short event if no node number is detected.
( You could identify these by filtering short events, passing long events, and then filter
by node number less than 1 ).
Changing the settings takes effect instantly.
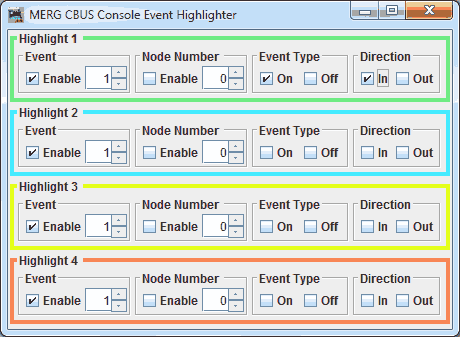
This window can be accessed from the Display options at top of the main console.
It can highlight a specific node or event CBUS message, both on and off options.
You will need at least 1 type ( or / off ) and 1 direction ( in / out ) to activate the highlight.
You can open a new Event Capture window from within the Console tool. The capture tool will share an event highlighter or filter with the console it was opened with.
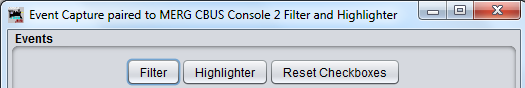
For more information, see the Event Capture Tool.
This window will close when the main console window is closed.
All OPCs supported, additional OPC information available.
Received OPCS can be from either other JMRI components, or from an external CBUS connection.
Very minor changes to OPC description text for increased screen readability.
You can view this help page within JMRI by selecting Help > Window Help in the top bar of the CBUS Console window.
CBUS® is a registered trade mark of Dr Michael Bolton